Authored by Lance Roberts via RealInvestmentAdvice.com,
▶ WEEK CLOSE: S&P 500 7,126.06 (+1.2%) | Nasdaq 13-Day Win Streak (longest since 1992) | Russell 2000 New ATH | Brent Crude -9.1% | VIX 17.42
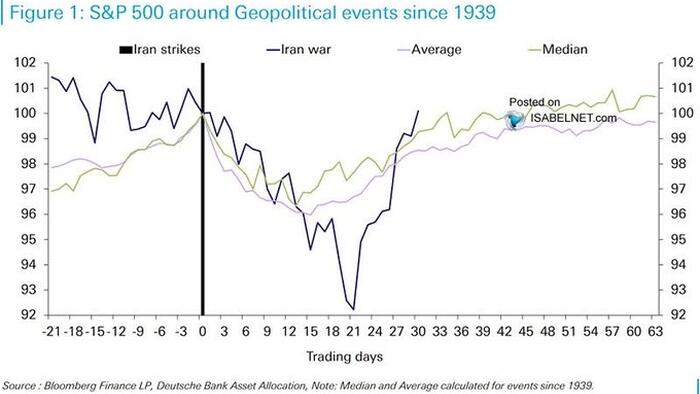
What began as a short-covering rally on April 7th has spent the last two weeks proving the bears wrong. Friday’s close at 7,126, the first finish above 7,100 in the index’s history, up 13.1% from the March lows, arrived alongside one of the most consequential single-session catalysts of the year. Iran declared the Strait of Hormuz“completely open.”Brent crude collapsed 9.1%. The Russell 2000 logged a new all-time high. The short-covering rally that skeptics said would exhaust itself in days has now run for three weeks and taken every major index to record territory.
The question every investor is asking right now isn’t whether to believe in the rally. The price action is undeniable, but the question is what kind of rally this actually is, and what investors who missed the initial short-covering rally should do about it.
The answer, as of Friday’s close, has shifted meaningfully.This no longer looks like a purely mechanical short-covering rally. The data is starting to point to something more durable. Here’s why that distinction matters, and what it means for your portfolio.
As we discussed in the #DailyMarketCommentary this past week, the recent price action felt like a release valve being pulled. Goldman’s prime brokerage flows guru, Lee Coppersmith, described a clear pivot toward risk-on, noting that sentiment has shifted toward FOMO among investors who dumped positions amid peak AI disruption fears and rising Middle East tensions.
That pivot makes sense from a mechanics standpoint. Short exposure across U.S. macro products, index futures, and ETFs had climbed to the 93rd percentile over the past five years, with hedge fund gross exposure near an all-time high of 307%. When the Iran ceasefire headlines crossed, that positioning became a coiled spring. Shorts covered, hedges unwound, and global equities were net bought for the first time in eight weeks, with Goldman’s Equity Fundamental Long/Short Performance Estimate rising 4.01%, the best weekly reading since February 2021.
That’s the good news, and we’ve seen this movie before. The build-up of stress in the market gets investors overly bearish, and then“hope”arrives, relieving the pressure. The“hope”causes a rush to gain positioning, short positions unwind sharply, and the headline indices surge.
The trap, however, is confusing the“market squeeze”with a new bull leg higher.Understanding which dynamic is actually driving this market right now is the most important analytical question any investor can ask.
The S&P 500 peaked at 7,002 on January 27th and spent the next eight weeks coming apart at the seams. The trigger wasn’t an earnings collapse or a credit event. It was a geopolitical shock that repriced three variables simultaneously: oil, inflation expectations, and the Federal Reserve’s flexibility.
Source: ZeroHedge News