Authored by Lance Roberts via RealInvestmentAdvice.com,
Pinned and Stretched
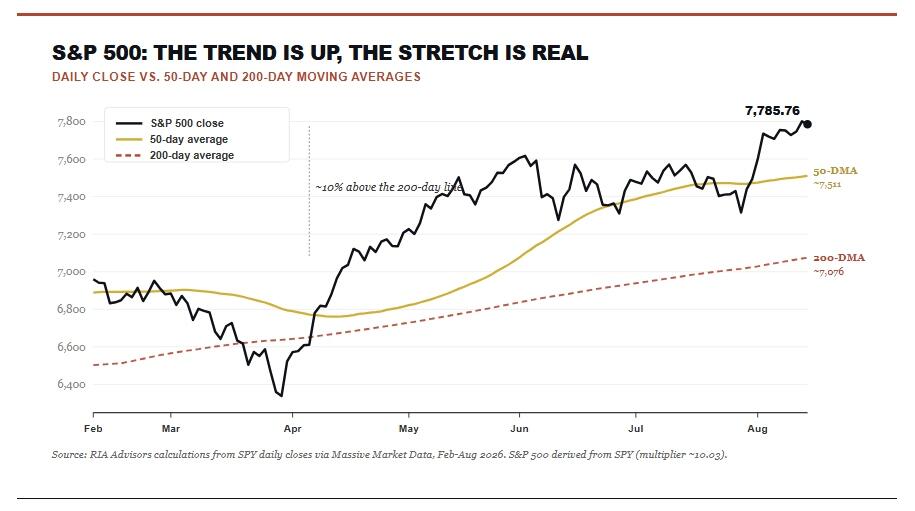
There is nothing bearish about the tape, and the overall trend could not be much cleaner. The S&P 500 sits above every major moving average and above a rising 200-day line it has not closed beneath since April. That is a healthy, intact uptrend, and it deserves respect. The problem is not the direction, but the distance from the longer-term trend, which is more concerning. As is always the case, deviations above the long-term trend eventually “revert to the mean.” We see it almost every year.
At Friday’s close, the index sat roughly 10% above its 200-day moving average. That is one of the widest gaps of this entire cycle, and it sits about 3.7% above the 50-day line, too. Add our Money Flow and Breadth Indicator at 80%, with 72% of members above their own 200-day average. This market has done a lot of work in a short window. Friday’s quiet fade from record highs is the kind of small caution flag that shows up when a tape gets this extended.
Look at the ceiling first. Price is pressed right against its own record highs, with Thursday’s 7,801 close and 7,817 intraday high just overhead. Above that sits the round 8,000 mark, which also happens to be Goldman’s year-end target. Round numbers act like magnets until they act like ceilings, so that’s where sellers tend to dig in. The floor sits much further away. First support is the 20-day line near 7,585, then the 50-day line near 7,510, both comfortably below Friday’s close. The takeaway is the asymmetry. There’s little cushion above, an