The United States and the European Union are the two largest Western economies of the 21st century.
Over the past two decades, however, their economic trajectories have diverged significantly.
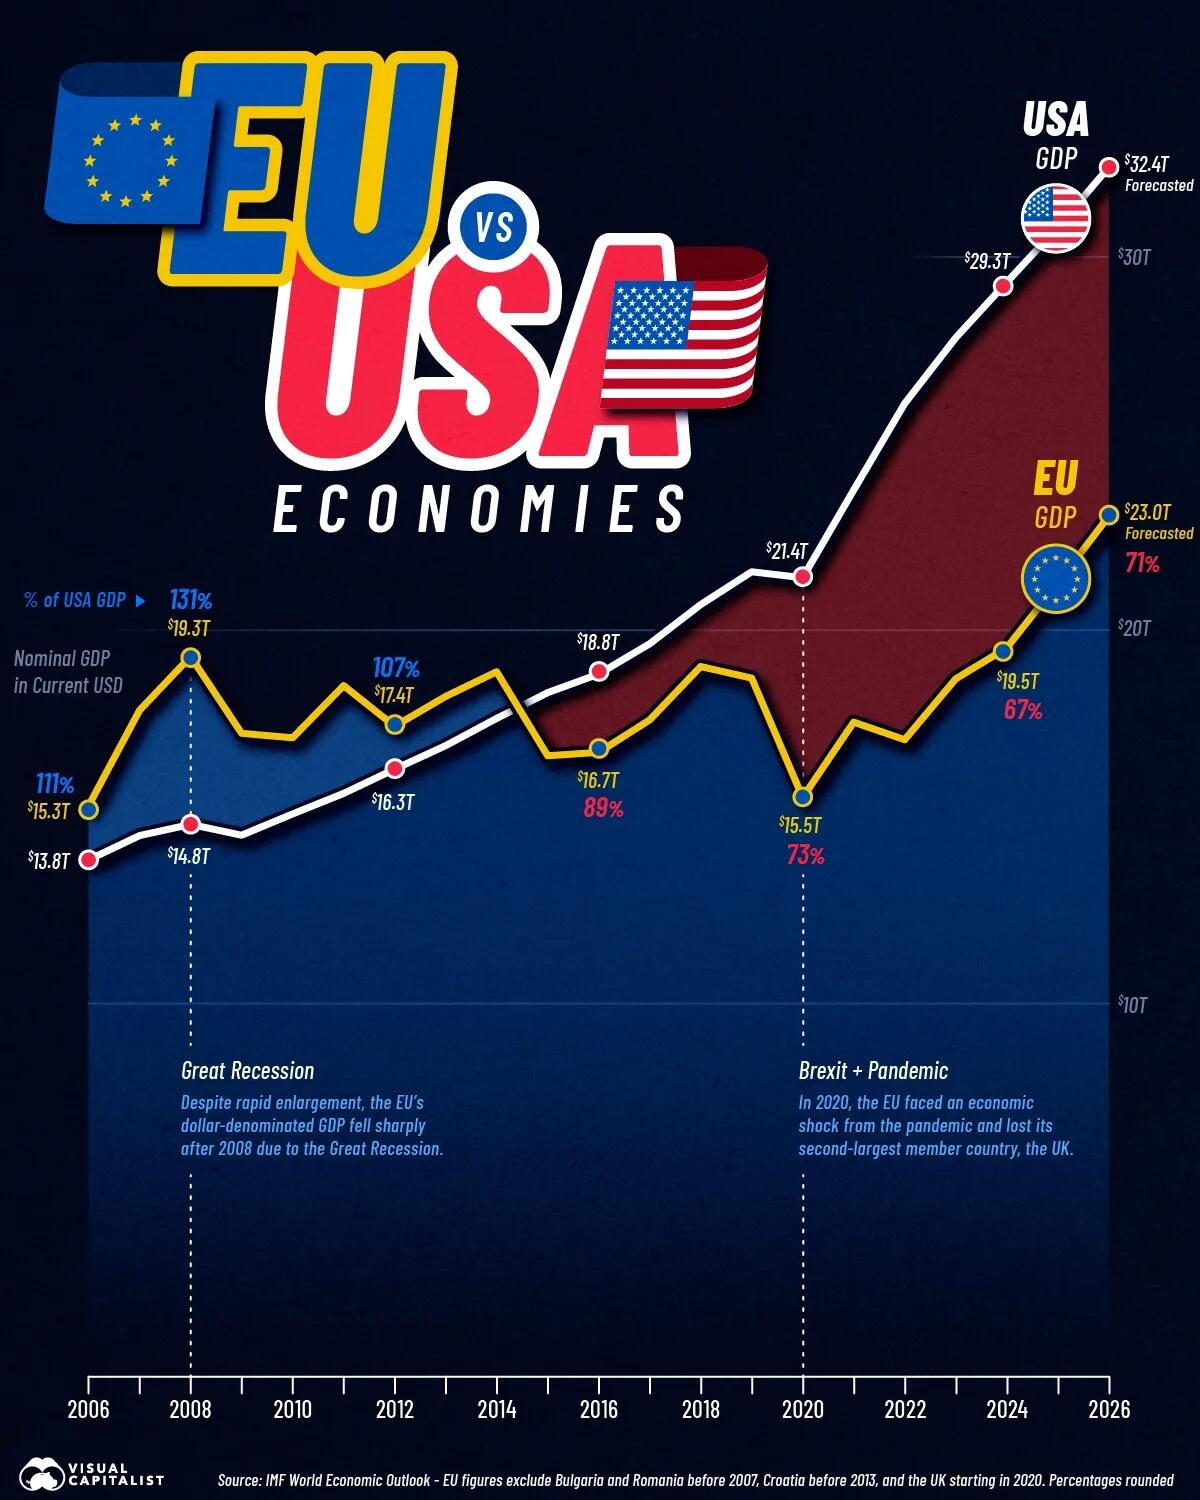
This line chart below, via Visual Capitalist's Gabriel Cohen, tracks the gross domestic product (GDP) of the EU and U.S. economies from 2006 to 2026 using the latest figures available from the International Monetary Fund (IMF)’s World Economic Outlook. Figures for 2026 are forecasts.
The Early Rise and Fall of the EU
The 15-member European Union was established in 1993 from precursor organizations such as the European Communities. In 2004, 10 new member states joined, followed by Bulgaria and Romania in 2007.
Aided by the addition of these new member states, along with strong British and German economies, the EU’s total GDP reached $19.3 trillion in 2008. This represented 131% of the U.S. economy that year, which stood at $14.8 trillion. The euro also reached an all-time high in June 2008 at roughly $1.55.
The table below shows the size of the EU economy relative to the U.S. economy from 2006 to 2026.
Year 🇪🇺 EU GDP ($T) 🇺🇸 U.S. GDP ($T) EU % of U.S. GDP 2006 15.27 13.82 110.5 2007 17.83 14.47 123.2 2008 19.27 14.77 130.5 2009 17.21 14.48 118.9 2010 17.09 15.05 11