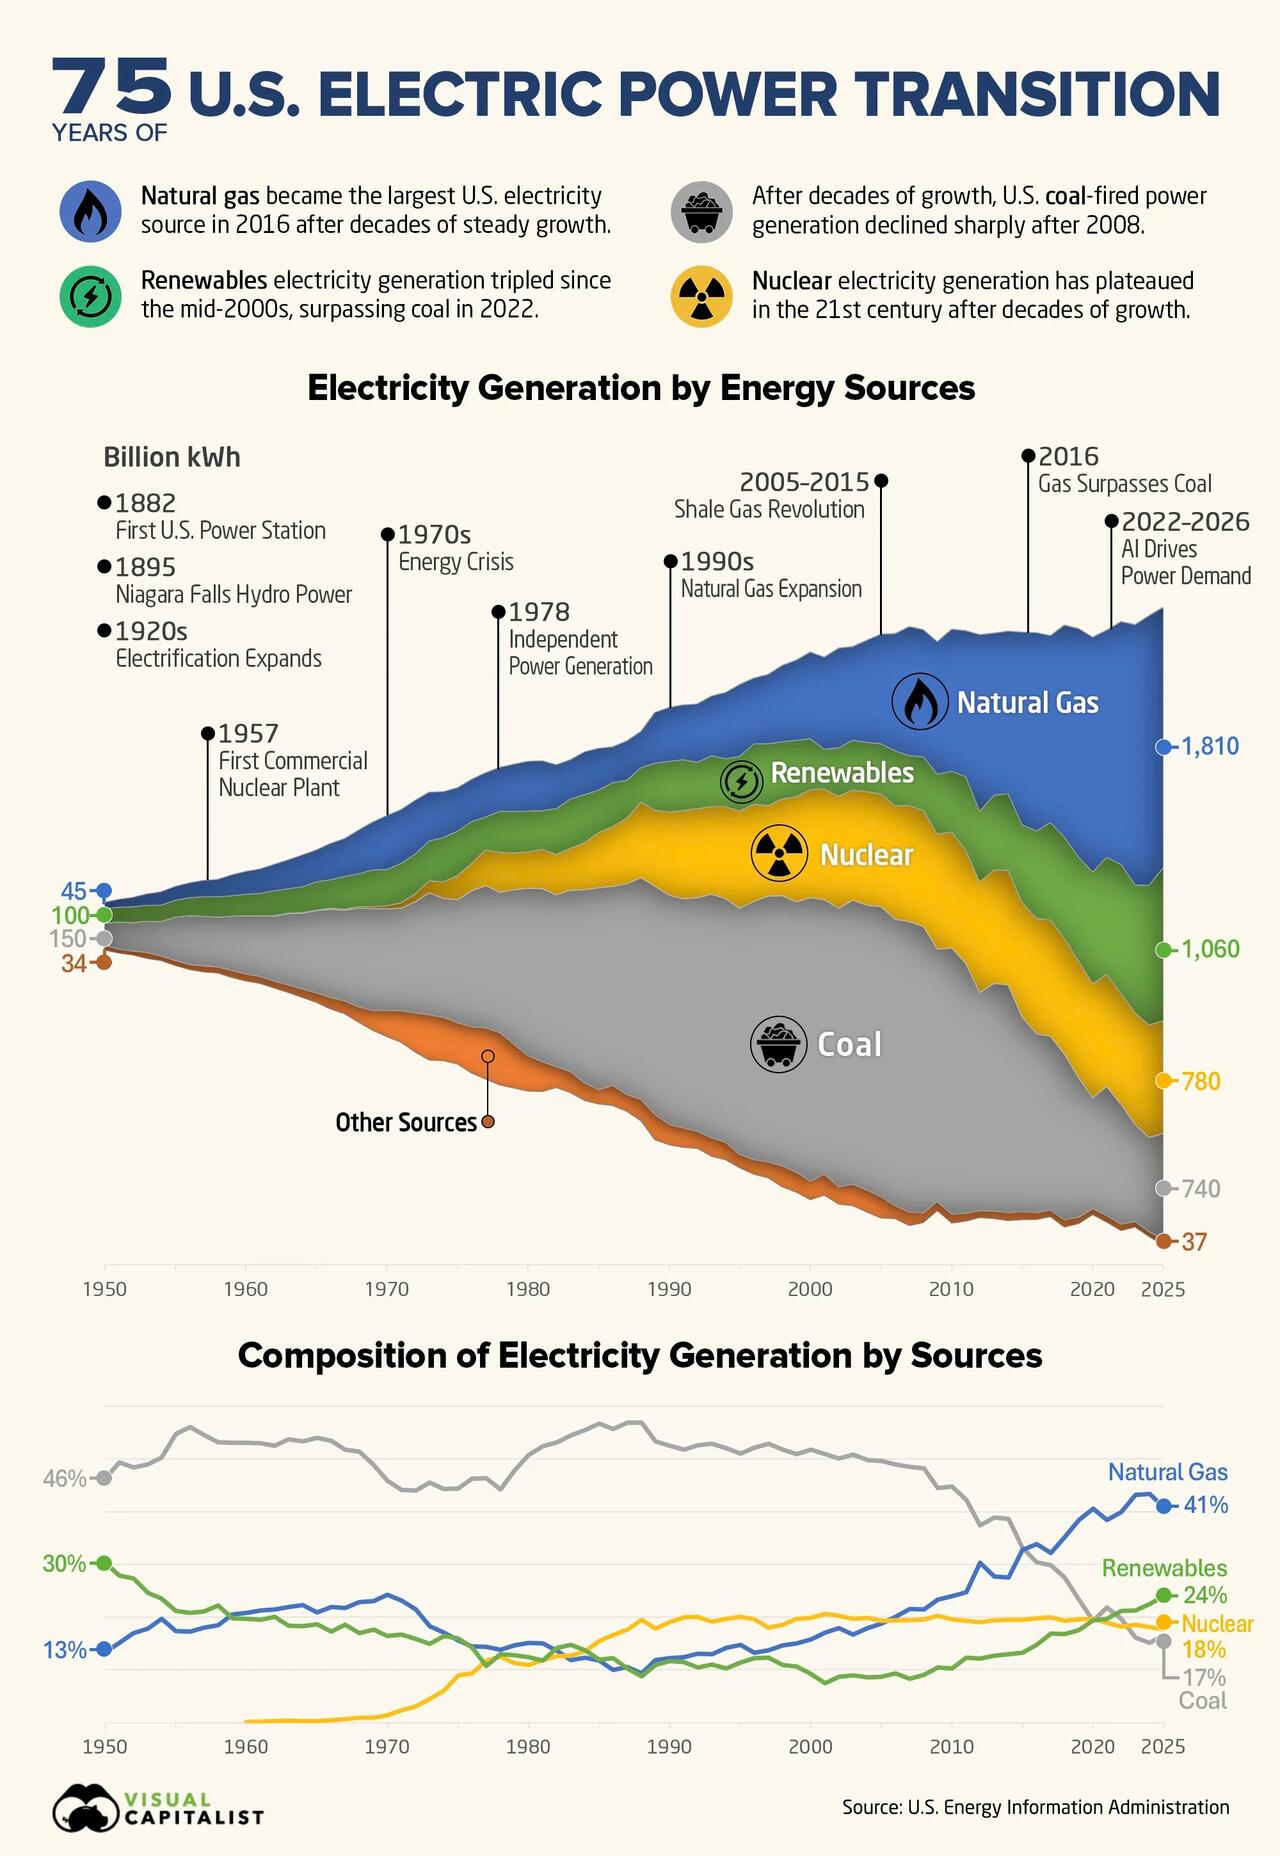
Over the past 75 years, the U.S. electricity system has shifted from one dominated by coal to one in which natural gas and renewables supply nearly two-thirds of generation.
This visualization, via Visual Capitalist's Niccolo Conte, shows annual U.S. electricity generation by source from 1950 to 2025 using data from the U.S. Energy Information Administration. It tracks output in billions of kilowatt-hours and each source’s share of the electricity mix over time.
Natural Gas and Renewables Lead U.S. Electricity Generation
Coal supplied 46.4% of U.S. electricity in 1950 and remained the country’s largest power source for decades. By 2025, however, its share had fallen to 16.6%. Natural gas moved in the opposite direction, rising from 13.5% to 40.8% and overtaking coal in 2016.
The table below shows each energy source’s share of total U.S. electricity generation at 15-year intervals from 1950 to 2025.
Energy Source Share of U.S. Electricity Generation 1950 1965 1980 1995 2010 2025 Natural Gas 13.5% 21.0% 15.1% 14.8% 24.0% 40.8% Renewables 30.2% 18.6% 12.4% 11.4% 10.2% 24.0% Nuclear 0.0% 0.4% 11.0% 20.1% 19.6% 17.7% Coal 46.4% 54.0% 50.7% 51.0% 44.8% 16.6% Petroleum and Other 10.2% 6.1% 10.7% 2.8% 1.5% 0.8%Renewables reached a 24.0% share in 2025 and have remained ahead of coal since 2022. Together, natural gas and renewables supplied 64.8% of U.S. electricity that year.
C