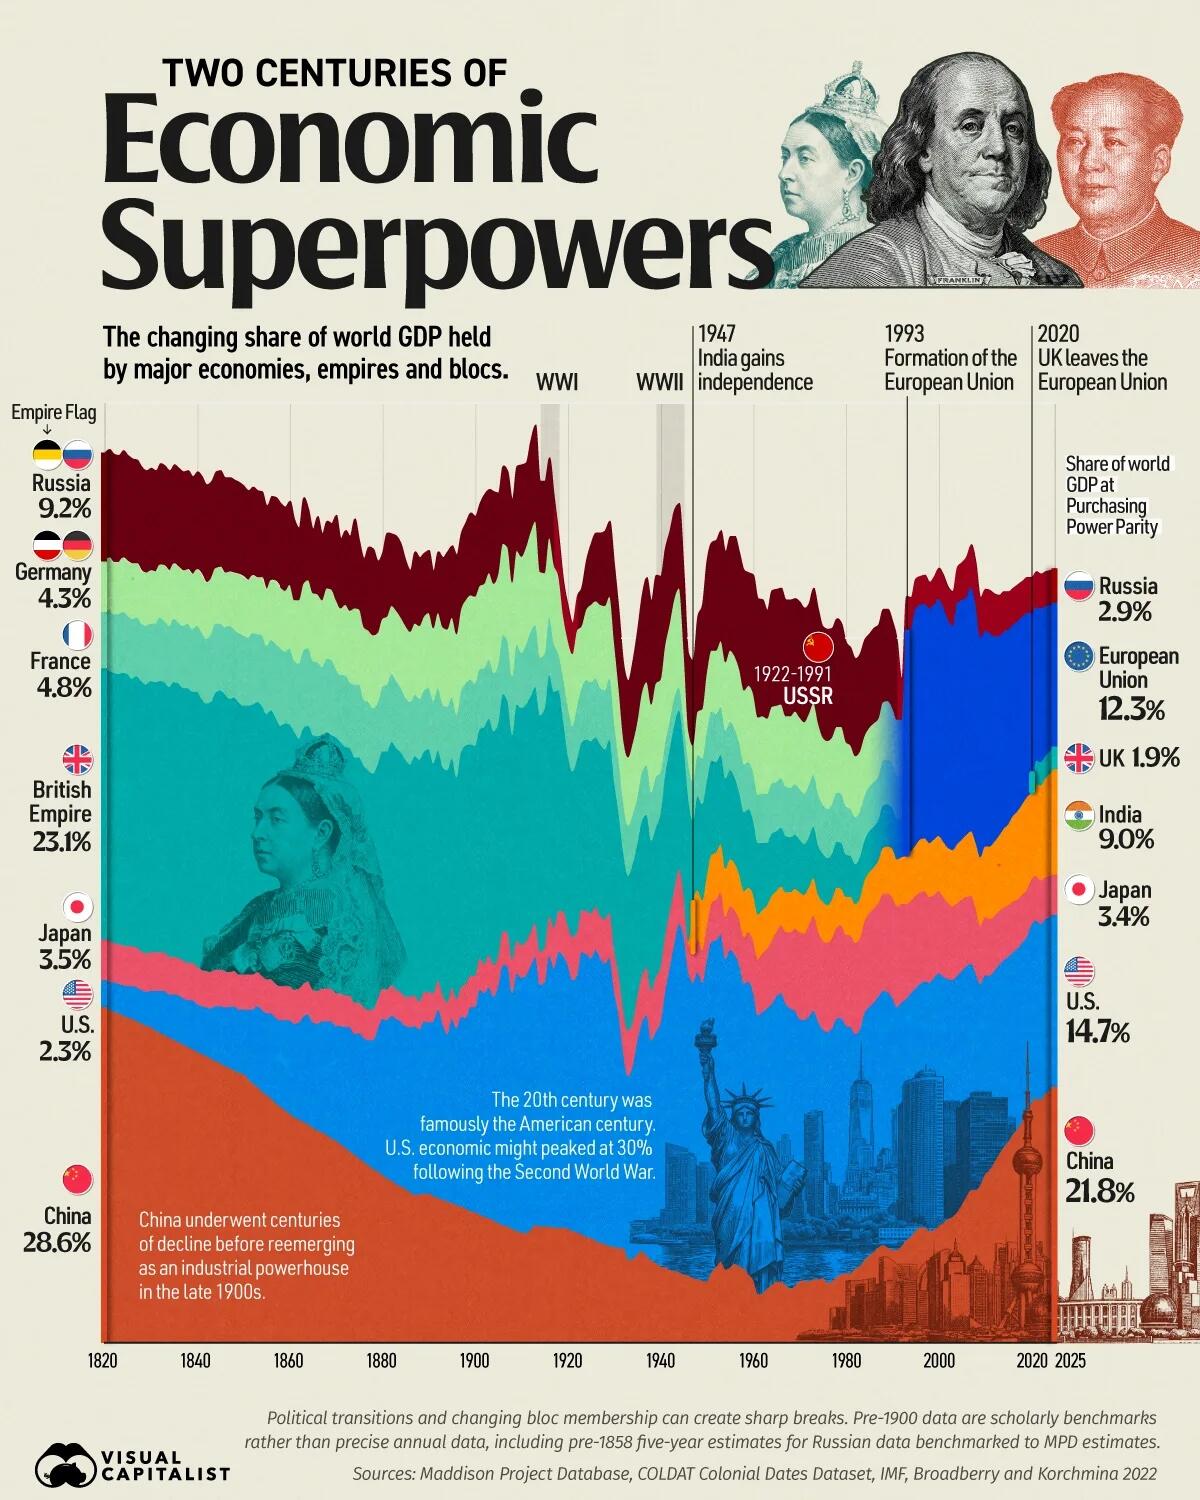
Over the last 200 years, economic leadership has shifted from China to the British Empire, then to the United States, and increasingly back toward Asia.
This streamgraph, via Visual Capitalist's Gabriel Cohen, tracks how the share of global gross domestic product (GDP) held by major economies changed from 1820 to 2025. The visualization incorporates the latest available data from the Maddison Project Database, the COLDAT Colonial Dates Dataset, and the IMF’s World Economic Outlook.
All GDP figures are adjusted for purchasing power parity (PPP), accounting for differences in living costs and production across countries.
The table below shows how each economy’s share of world GDP changed across two centuries:
Economy Share of World GDP (%) 1820 1855 1890 1925 1960 1995 2025 🇨🇳 China 28.6% 21.1% 12.7% 8.9% 5.3% 9.5% 21.8% 🇺🇸 U.S. 2.3% 7.0% 14.6% 23.9% 24.5% 20.7% 14.7% 🇪🇺 EU — — — — — 17.0% 12.3% 🇮🇳 India — — — — 3.9% 4.3% 9.0% 🇯🇵 Japan 3.5% 2.9% 2.6% 3.8% 4.5% 7.9% 3.4% 🇷🇺 Russia / USSR 9.2% 7.1% 5.3% 5.2% 10.1% 2.5% 2.9% 🇬🇧 Britis