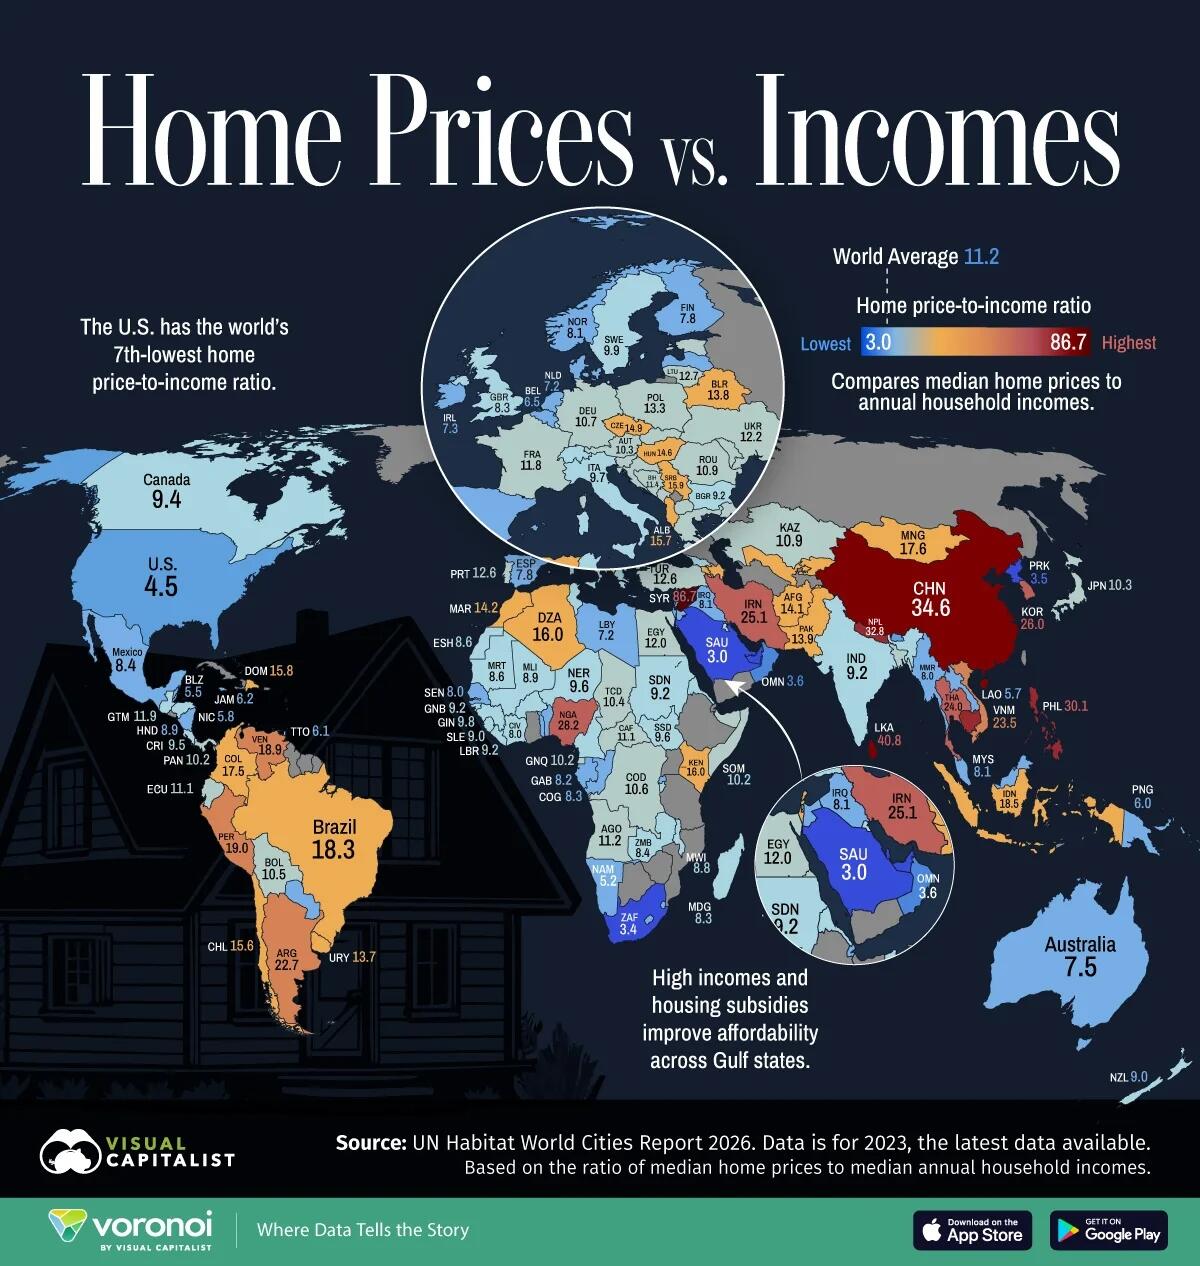
Housing affordability has become a defining economic issue across much of the world, but the relationship between home prices and incomes differs more than many people realize.
Using data from the UN Habitat World Cities Report 2026, Visual Capitalist's Dorothy Neufeld created this map comparing median home prices with annual household incomes across more than 180 countries, revealing where buying a home is relatively attainable—and where it remains far out of reach.
The World’s Most Affordable Housing Markets
Saudi Arabia and the UAE have the lowest home price-to-income ratios in the dataset at 3.0. The U.S. ranks seventh-lowest at 4.5, below Canada (9.4), Australia (7.5), and the UK (8.3).
The ratio shows how many years of median household income would be needed to match the median home price. A lower figure indicates greater affordability, though the measure does not account for mortgage rates or other homeownership costs.
RankCountryHome Price-to-Income Ratio 1🇸🇦 Saudi Arabia3.0 2🇦🇪 UAE3.0 3🇿🇦 South Africa3.4 4🇰🇵 North Korea3.5 5🇴🇲 Oman3.6 6🇳🇷 Nauru4.0 7🇺🇸 U.S.4.5 8🇹🇻 Tuvalu5.0 9🇳🇦 Namibia5.2 10🇹🇱 Timor-Leste5.2 11🇵🇲 Saint Pierre and Miquelon5.2 12🇶🇦 Qatar5.3 13🇧🇹 Bhutan5.5 14🇧🇿 Belize5.5 15🇸🇧 Solomon Islands5.5 16🇵🇼 Palau5.5 17🇹🇴 Tonga5.5 18🇵🇸 State of Palestine5.6 19🇱🇦 Laos5.7 20🇩🇲 Dominica5.7 21🇳🇮 Nicaragua5.8 22🇻🇺 Vanuatu5.8 23🇬🇩 Grenada5.9 24🇫🇯 Fiji6.0 25🇵🇬 Papua New Guinea6.0 26🇼🇸 Samoa6.0 27🇹🇹 Trinidad and Tobago6.1 28🇲🇺 Mauritius6.2 29🇷🇪 Réunion6.2 30