Natural population growth is slowing across much of America.
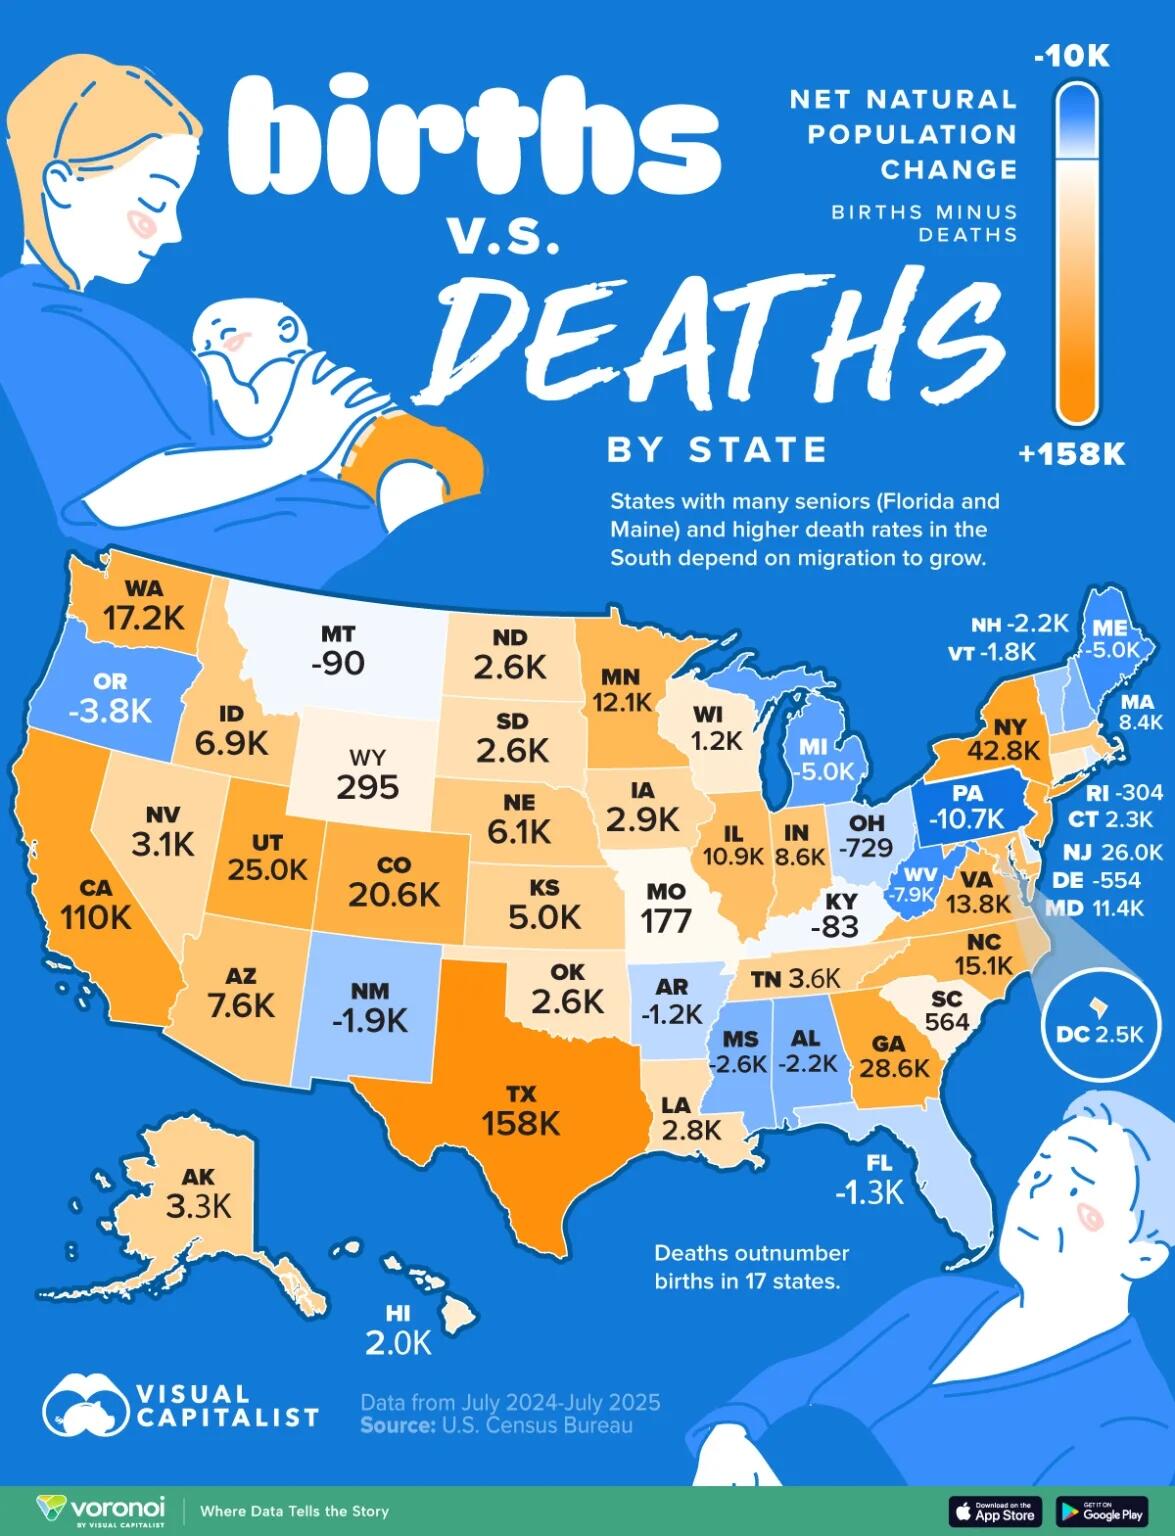
According to the latest U.S. Census Bureau estimates, 17 states recorded more deaths than births between July 2024 and July 2025, up from only four states during much of the 2010s.
Using U.S. Census Bureau data, Visual Capitalist's Dorothy Neufeld created this map showing natural population change in every state.
Because the measure excludes domestic and international migration, it highlights where population growth increasingly depends on people moving in.
Natural Population Change by State
The table below ranks every state by natural population change between July 2024 and July 2025, highlighting where births continued to outpace deaths—and where they no longer did.
State Natural Population ChangeJul 2024–Jul 2025 Pennsylvania -10,708 West Virginia -7,887 Maine -5,019 Michigan -4,998 Oregon -3,764 Mississippi -2,607 Alabama -2,188 New Hampshire -2,167 New Mexico -1,885 Vermont -1,769 Florida -1,333 Arkansas -1,224 Ohio -729 Delaware -554 Rhode Island -304 Montana -90 Kentucky -83 Missouri 177 Wyoming 295 South Carolina 564 Wisconsin 1,161 Hawaii 2,024 Connecticut 2,283 District of Columbia 2,516 Oklahoma 2,559 South Dakota 2,605 North Dakota 2,630 Louisiana 2,774 Iowa 2,949 Nevada 3,051 Alaska 3,30