Authored by Lance Roberts via RealInvestmentAdvice.com,
📈Technical Backdrop – Coiling Below The Record
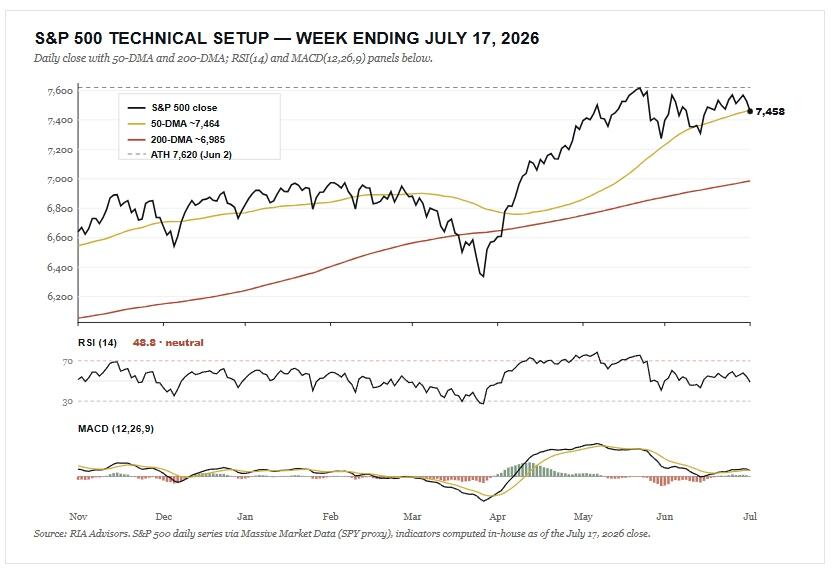
Here is where the quiet-index story gets interesting for traders. The S&P 500 closed the week at 7,457.69, and that put it right on top of its 50-day moving average near 7,464. Call it dead flat against the line. The index still sits about 6.8% above its rising 200-day average near 6,985, so the primary uptrend remains fully intact, and it is roughly 2% below the June 2 record high of 7,620.
Momentum on the index itself is neutral, not broken. The 14-day RSI reads 48.8, smack in the middle of its range and nowhere near oversold. The MACD is the wrinkle. It just rolled below its signal line for the first time since the April low, and the histogram flipped negative. That is a fresh bearish crossover. One crossover is not a sell signal, but it is exactly the kind of longer-term warning we watch for as a correction builds.
The contrast between the index and the factor is the whole point. The Momentum ETF, MTUM, fell about 6% on the week and printed a 14-day RSI of 41, far weaker than the broad market. The average stock barely flinched. The equal-weight S&P lost less than half a percent and actually tagged a fresh record high midweek, and the Russell 2000 held up better than the Nasdaq. When the cap-weighted index falls, but the median stock does not, the damage is narrow by definition.
« Back to The Culture War