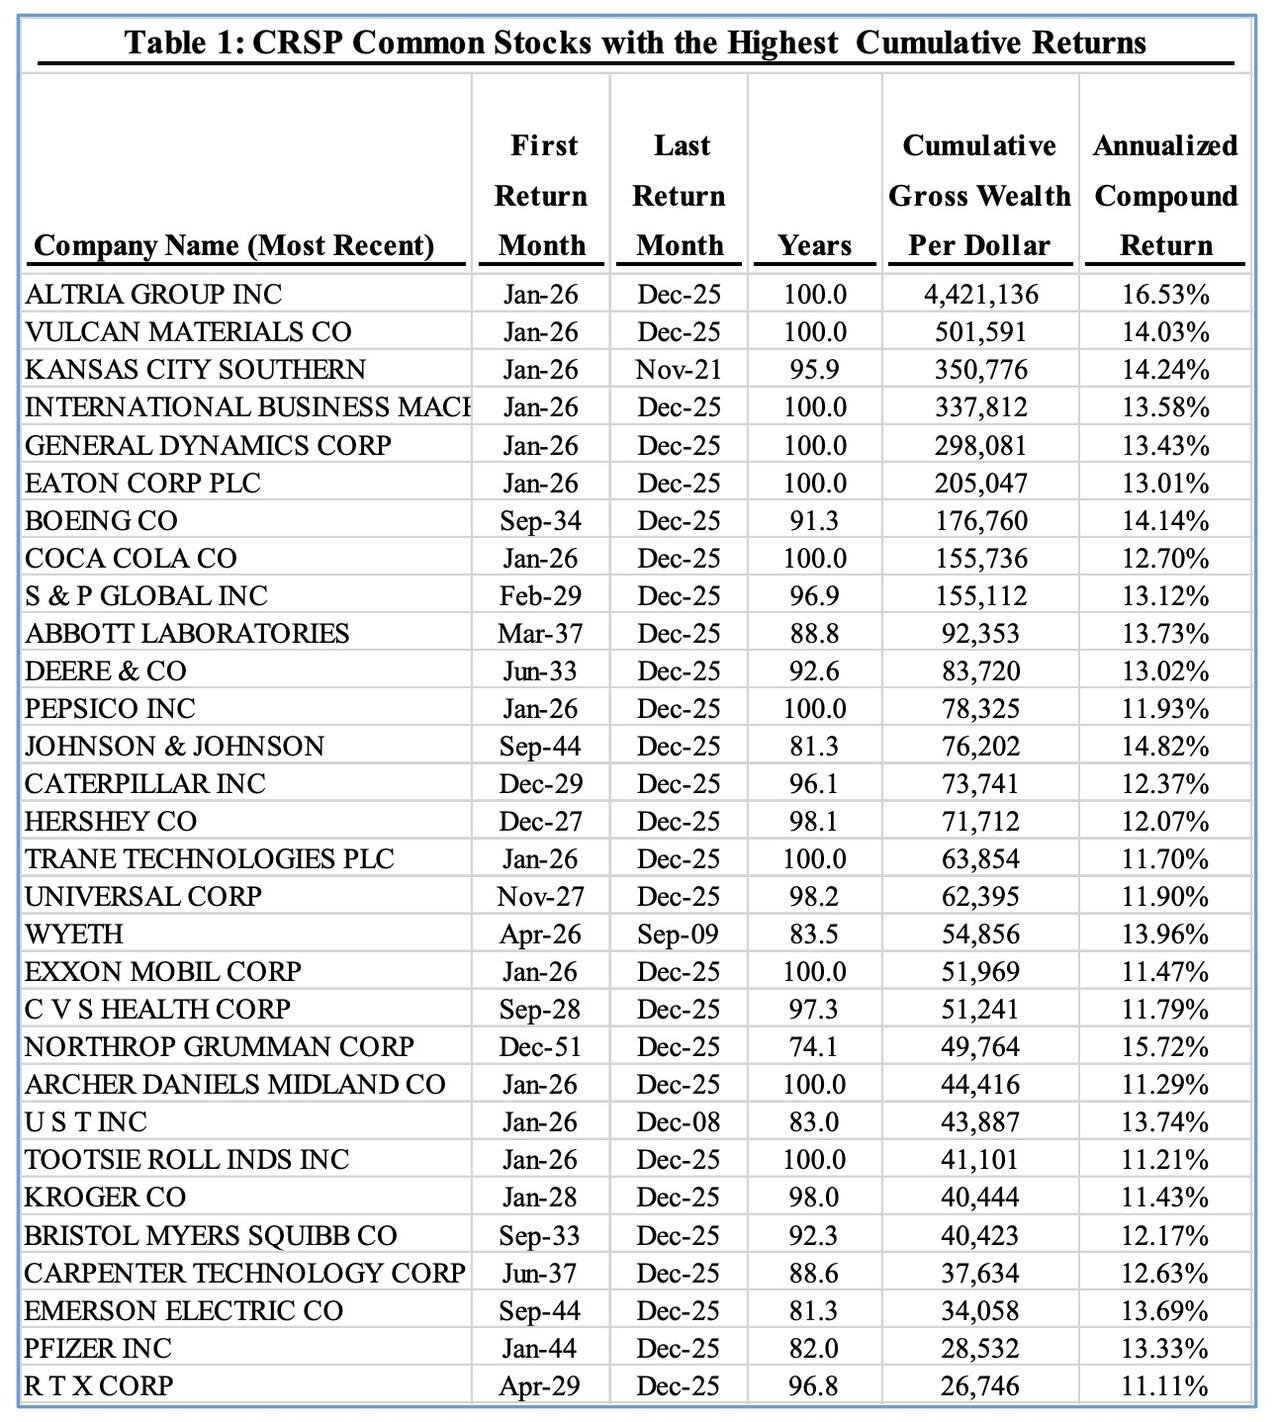
From 1926 through 2025, just 27.6% of stocks beat the broader market. Nearly 60% actually destroyed shareholder wealth, and the median stock delivered a lifetime return of -6.9%. Yet despite those sobering odds, U.S. stocks collectively created roughly $91 trillion in wealth over the last century, with just 46 companies responsible for half of it.
Those are some of the headline findings from a new study by Hendrik Bessembinder of Arizona State University's W.P. Carey School of Business, who examined the performance of nearly 30,000 U.S. stocks over the last century. The research paints a striking picture of how wealth is actually created in the stock market: while broad market indexes have generated exceptional long-term returns, the vast majority of individual stocks have failed to keep pace.
Bessembinder analyzed 29,754 publicly traded U.S. stocks between 1926 and 2025. Over that period, the overall stock market produced an annualized return of about 10.1%, turning every dollar invested into more than $15,000, according to the study, detailed in this white paper.
But those impressive aggregate returns mask an uncomfortable reality. The typical stock fared far worse. In fact, the median stock lost 6.9% over its lifetime, fewer than half of all stocks generated a positive lifetime return, only about 41% outperformed Treasury bills during the time they were publicly traded, and just 27.6% managed to outperform the market itself.
The reason is simple: stock market returns are incredibly uneven. While any stock can fall to zero, there