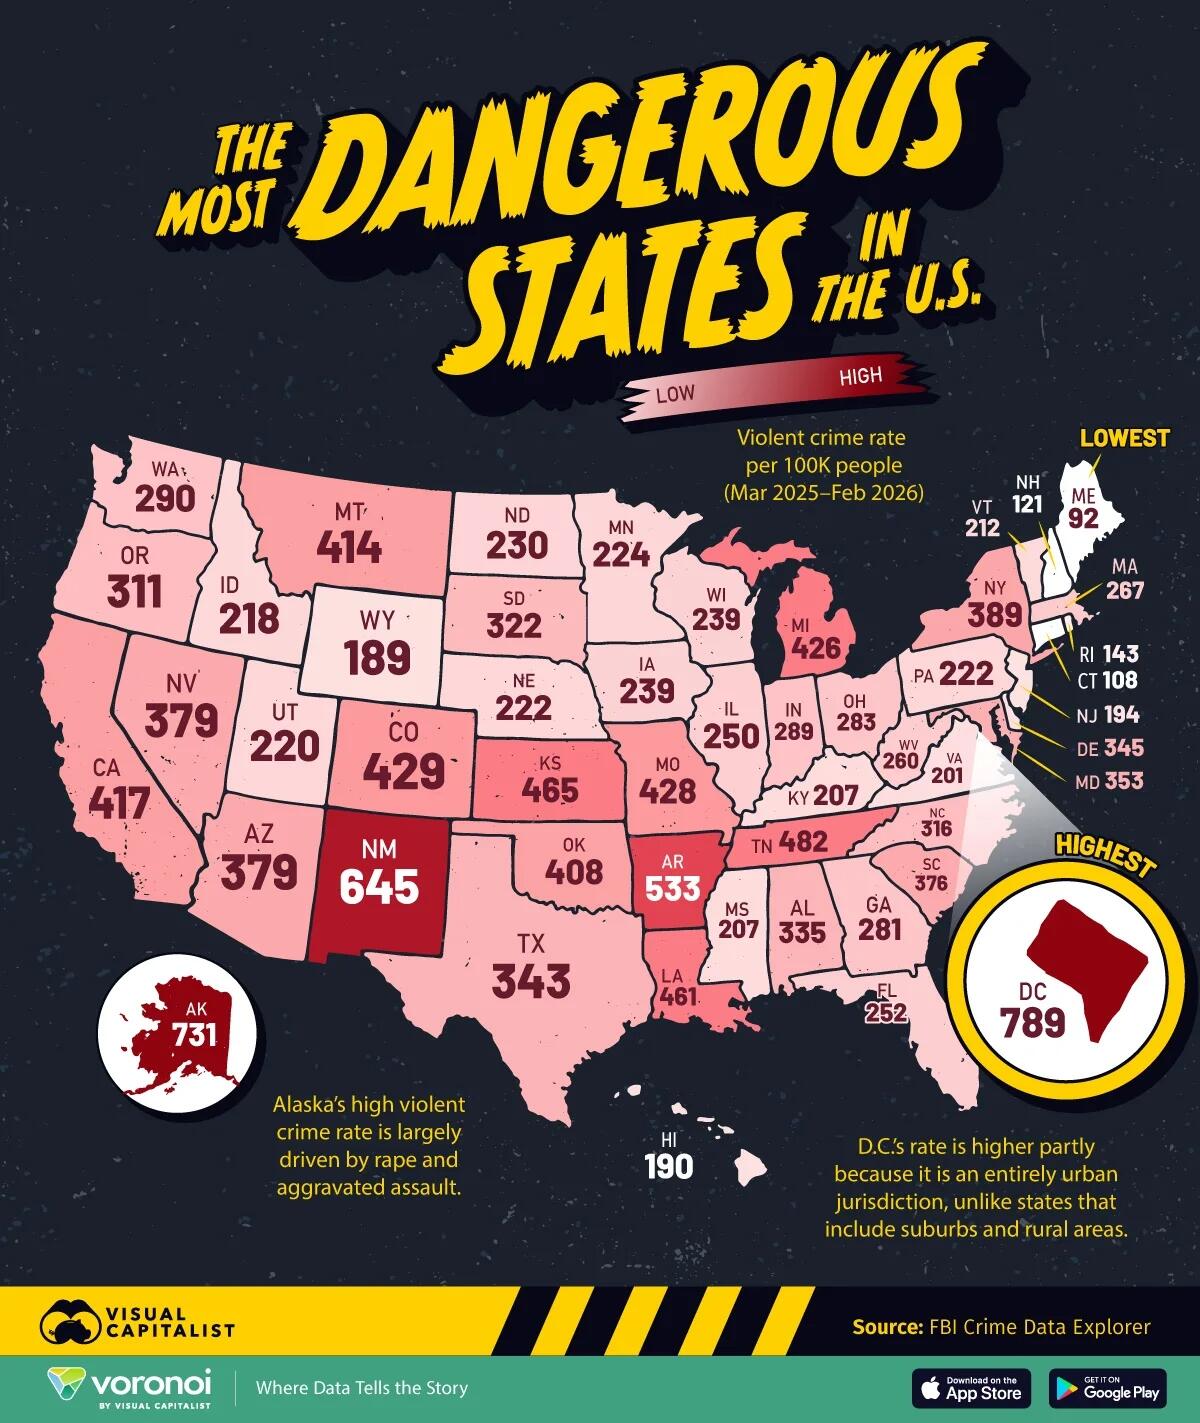
Where you live can significantly affect your likelihood of experiencing violent crime, with reported rates varying severalfold across the United States.
This map, via Visual Capitalist's Bruno Venditti, ranks every U.S. state and the District of Columbia by reported violent crimes per 100,000 residents between March 2025 and February 2026.
The figures include murder, rape, robbery, and aggravated assault, using data from the FBI Crime Data Explorer.
Washington, D.C. and Alaska Top the Rankings
Washington, D.C. recorded the nation’s highest violent crime rate at 789 incidents per 100,000 residents.
D.C.’s rate is partly elevated because it is an entirely urban jurisdiction, unlike states that also include suburban and rural areas.
Rank State/District Violent crime rate per 100K people (Mar 2025–Feb 2026) 1 District of Columbia 789 2 Alaska 731 3 New Mexico 645 4 Arkansas 533 5 Tennessee 482 6 Kansas 465 7 Louisiana 461 8 Colorado 429 9 Missouri 428 10 Michigan 426 11 California 417 12 Montana 414 13 Oklahoma 408 14 New York 389 15 Arizona 379 16 Nevada 379 17 South Carolina 376 18 Maryland 353 19 Delaware 345 20 Texas 343 21 Alabama 335 22 South Dakota 322 23 North Carolina 316 24 Oregon 311 25 Washington 290 26 Indiana 289 27 Ohio 283 28 Georgia 281 29