Authored by Lance Roberts via RealInvestmetAdvice.com,
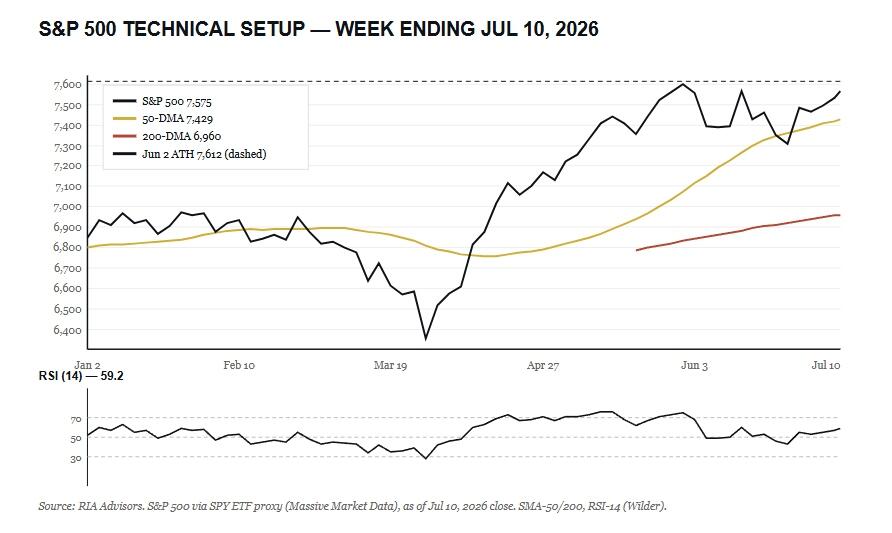
Price closed Friday at 7,575, sitting 1.86% above its rising 50-day moving average near 7,429 and a healthy 8.7% above the 200-day average at roughly 6,960. Both averages slope higher, and the price is above both. That is a bullish structure, full stop. The 14-day RSI reads 59, which is firmly neutral with room to run before it flashes overbought, and the MACD remains in a positive posture with the signal line trailing below. Momentum is constructive, not stretched.
The wrinkle is under the surface. This week’s advance was driven by a handful of names while the equal-weight index and small caps slipped, so the momentum you see on the chart is thinner than it looks. We have maintained equity exposure at target weight in our models since April 17, and this is precisely the tape that argues for discipline rather than taking on fresh risk. When the generals march, and the troops sit, you respect the trend, but you tighten your stops.
Volume told the same story as breadth. The push toward the highs came on unremarkable participation, and the new-high lists were dominated by the same technology and communication-services names that led the tape all week. That is not the broad thrust you want confirming a durable breakout to fresh records. At nearly 9% above the 200-day average, the index is not dangerously stretched, but it is closer to the top of its typical band than the bottom, which is another argument for buying pullbacks rather than chasing breakouts. It does not break the uptrend. It lowers the quality of it.