Authored by Adam Sharp via DailyReckoning.com,
I have 5 charts for you today which put this crazy market into context and give some clarity on what might come next.
We’re at a fascinating crossroads for markets, geopolitics, and finance.
Let’s get started.
Semis Party Like It’s 1999
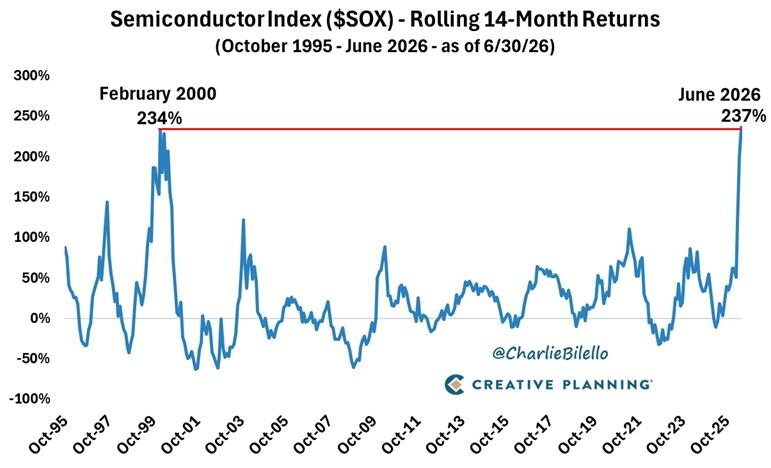
First up, semiconductor returns. The index below includes U.S. semi stocks like Nvidia, Micron, Intel, Broadcom, Marvell, Texas Instruments, and more:
Source: Charlie Bilello
As you can see, during the dotcom bubble, semiconductor stocks soared 234% over 14 months in the period leading up to February 2000. That was the peak of the market, and tech stocks wouldn’t recover for about 15 years.
And in the past 14 months, SOX is up 237%. Reminiscent of the dotcom days.
Maybe this time is different, and yes, the stocks are more profitable today. But it’s undeniable that markets are getting bubbly. Semis are looking especially frothy. When AI spending inevitably slows down, watch out below…
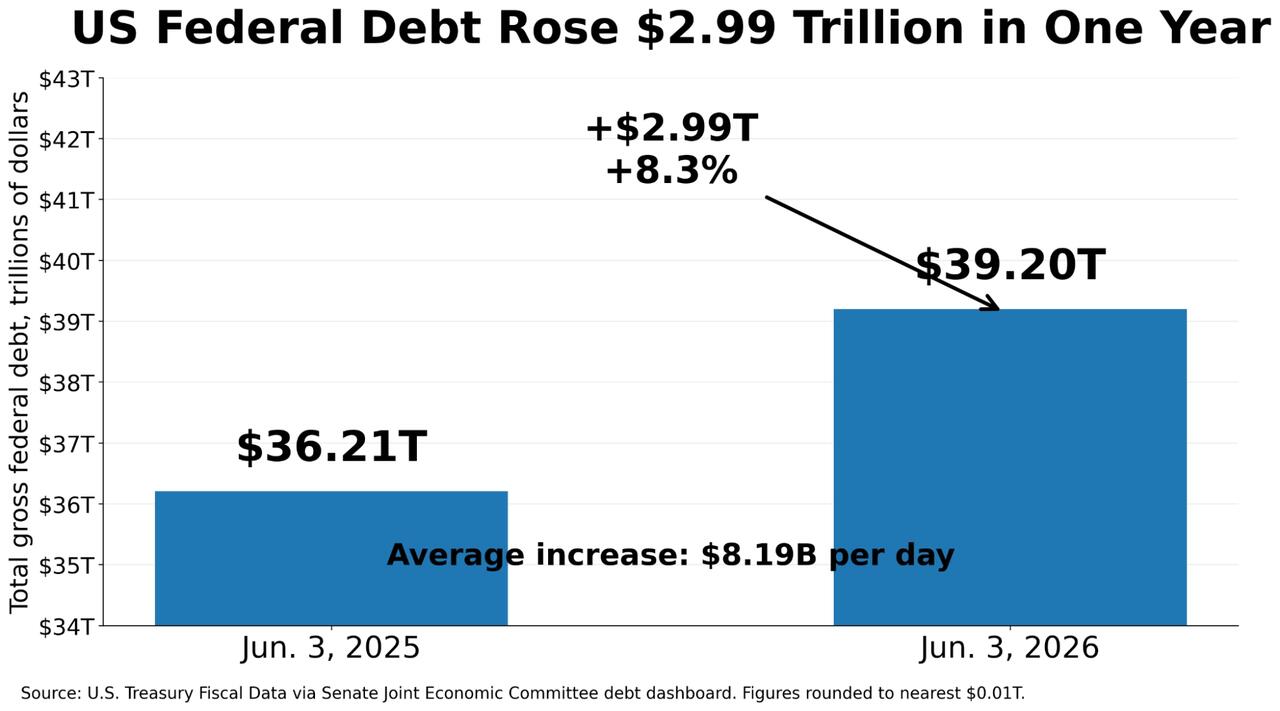
+$2.99 Trillion
Over the past year, America’s federal debt jumped by $2.99 trillion.
Needless to say, our current trajectory is unsusta