
Authored by Sylvia Xu via The Epoch Times,
The United States has transformed from a collection of 13 eastern colonies into a transcontinental nation spanning 50 states, one district, and five major territories—a geographic expansion forged through land purchases and war treaties.
America’s two-and-a-half-century evolution includes not only geographic growth, but also transformations in population, family structures, wages, the housing market, and health.
Through data and graphics, here is a look at how the country has changed over 250 years.
Changing Face of America
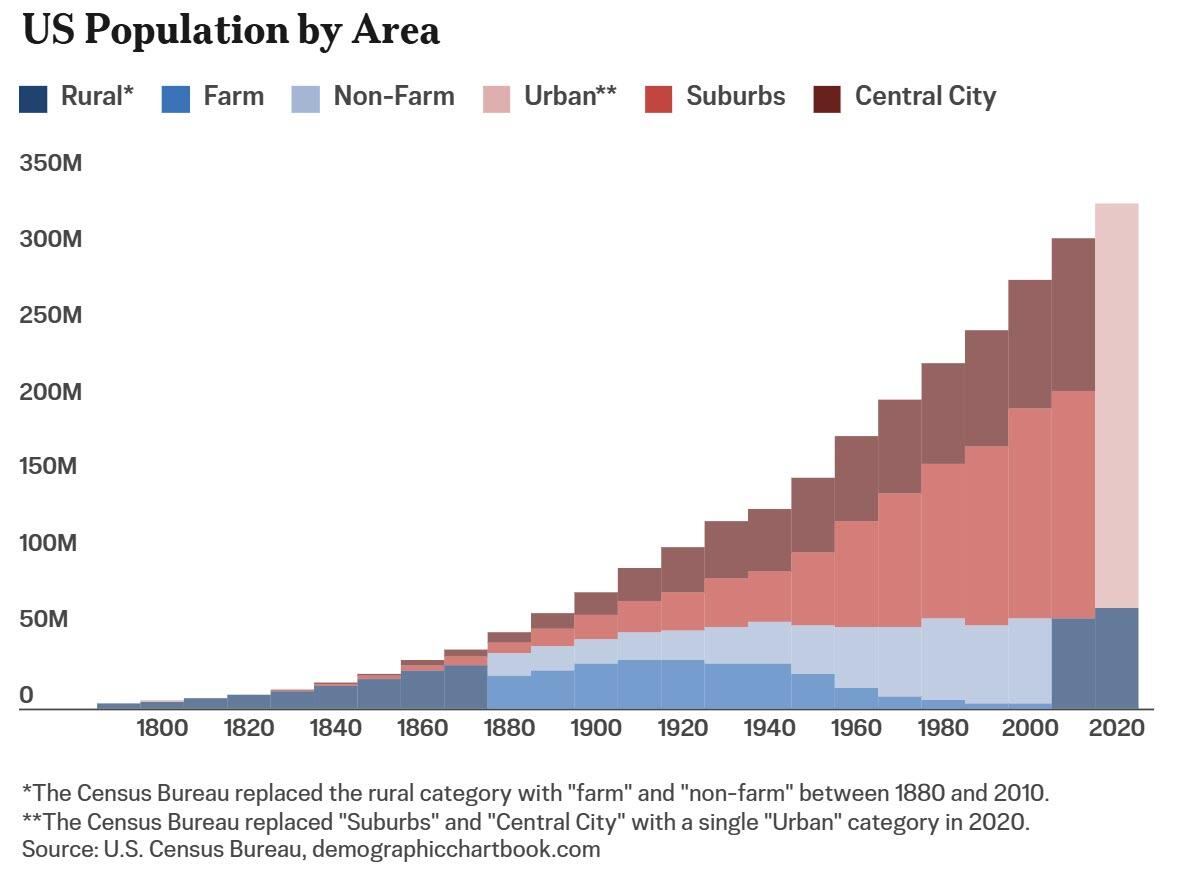
In 1790, 95 percent of Americans resided in rural areas; by 2020, that figure had dropped to 20 percent.
This demographic shift transformed the rural landscape itself. More than 50 percent of rural residents lived on farms prior to 1940, but that share dwindled to a mere 5 percent by 2000.
Although the U.S. urban population surged from 5 percent in 1790 to 80 percent in 2020, this growth shifted heavily toward suburban and outlying areas after 1950, leaving central cities with less than half of the total urban population.
While domestic migration altered where Americans lived, shifting global immigration patterns simultaneously refined who made up the nation.
The number of U.S. foreign-born residents grew from 2.2 million in 1850 to 50.2 million in 2024, or from 9 percent of the national population to nearly 15 percent.
Europe supplied the majority of immigrants during a century-long window from 1850 to 1970