Authored by Michael Lebowitz via RealInvestmentAdvice.com,
The price movement in the broad S&P 500 index is relatively calm. Yet the market’s undercurrent, as measured by sharply diverging returns across stock sectors and factors, is anything but calm. The current market picture we paint is well embodied by a quote from Jules Verne in 20,000 Leagues Under the Sea.
“The sea was perfectly calm; scarcely a ripple disturbed its surface. But beneath this tranquil exterior, powerful currents were flowing with irresistible force.”
Given this divergence between the calm market surface and the volatility of its underlying stocks’ returns, let’s get a better grip on the market’s undercurrent and decipher what it may be trying to tell us.
The graph below shows that the S&P 500’s upward trend has recently flattened into a tight range with minimal volatility. Such consolidation is common after a sharp upward price trend, as the market experienced since early April.
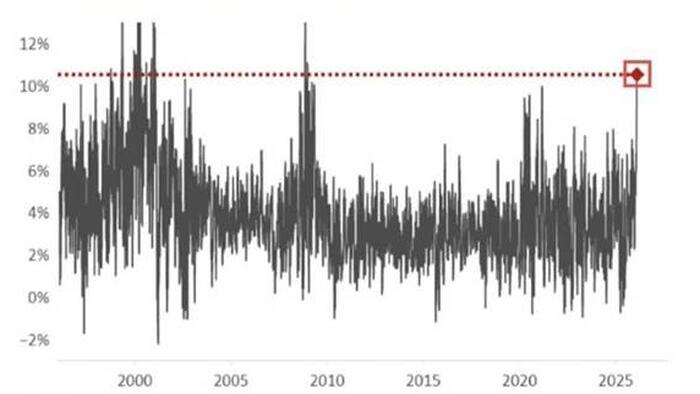
The next graph shows the average true range (ATR) for the index. ATR is a measure of realized volatility. As we define it, ATR is the percentage difference between the highest and lowest intraday prices over a rolling 20-day period. The current ATR is only about 3%, near the bottom of the range since 2015. It is also less than half the ten-year average.
Both charts point to a relatively calm market with limited volatility. It’s worth noting that implied volatility (expected volatility) on the S&P 500 is around 20. While not low, it doesn’t suggest that investors expect significant volatility in the weeks ahead.
While the broad S&P 500 market index is relatively calm, its undercurrent is anything but tranquil. Significant rotation trades, characterized by heavy trading activity in and out of various sectors and factors, have led to large daily divergences in the performance of certain sectors and stock factors.
We use the dispersion of returns to quantify the market’s fierce undercurrent. For this article, we take the 20-day percentage price changes for sector and factor groups and then calculate the standard deviation of those changes. The more divergent the returns, the higher the standard deviation.
The first graph below shows that the current standard deviation of returns across all sectors is at its second-highest level since early 2023.
Source: ZeroHedge News