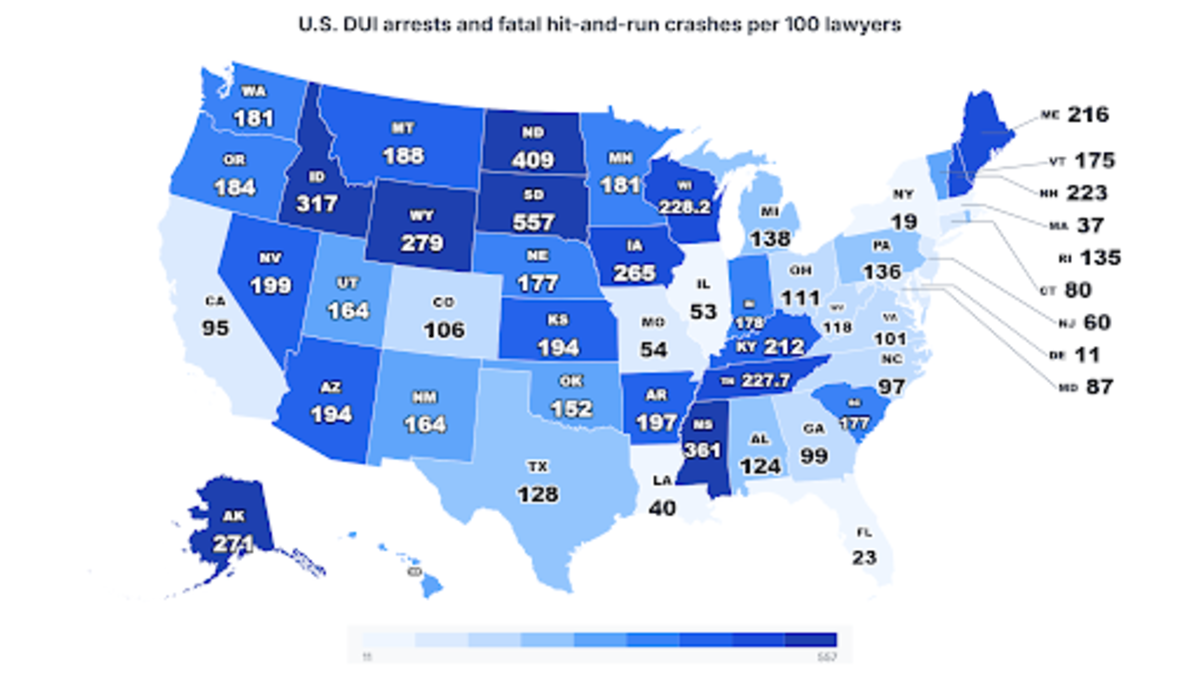
Combined annual DUI arrests and fatal hit-and-run crashes total roughly 689,514 cases nationwide. Measured against each state’s employed-lawyer workforce, the per-100-lawyer rate runs from 557 at the top to 11 at the bottom, a gap of roughly 50 times.
This study, conducted byKitchel Lawdivides each state’s combined average annual DUI arrests (FBI UCR, 2021-2025) and fatal hit-and-run crashes (NHTSA FARS, 2020-2024) by its average annual employed-lawyer headcount (BLS OES, 2020-2024) and multiplies by 100 to produce a per-100-lawyer rate, a comparative proxy for per-lawyer case-volume exposure, not a literal caseload per attorney.
States With the Highest Per-Lawyer Case Exposure
Sources: FBI Crime Data Explorer; NHTSA FARS via CDAN; U.S. BLS Occupational Employment and Wage Statistics.
The top of the ranking is dominated by states with compact resident lawyer workforces, where moderate absolute case counts translate into outsized per-lawyer ratios. Wisconsin and Tennessee are the exceptions, each clearing 8,000 employed lawyers yet ranking in the top 10 on the strength of combined case volumes above 19,000 per year.
States With the Highest Absolute Combined Case Volume
Sources: FBI Crime Data Explorer; NHTSA FARS via CDAN; U.S. BLS Occupational Employment and Wage Statistics.
Raw case volume does not track the per-lawyer ranking: California, Texas, and Pennsylvania lead in absolute cases but fall between 31st and 41st per lawyer due to their large resident lawyer workforces. Tennessee is the only state in this volume top 10 to also place in the per-lawyer top 10.
States With the Lowest Per-Lawyer Case Exposure
Sources: FBI Crime Data Explorer; NHTSA FARS via CDAN; U.S. BLS Occupational Employment and Wage Statistics.
Source: Insider Paper
